Today’s numbers are $3.3 million and one — the revenue from local meals and hotel-motel taxes and where Andover ranked last fiscal year among 16 peer communities in eastern Massachusetts in receipts for those taxes.
They also signify a healthy rebound in the town’s commercial health since the depths of the COVID-19 pandemic cut those proceeds by two-thirds.
These excise taxes represent less than one-and-a-half percent of Andover’s revenue, but they reduce pressure on the property tax base, the principal source of municipal income.
For last fiscal year, Andover collected more than $2.4 million from the 6-percent local tax on room rentals (on top of the 5.7 percent charged by the state), and $873,000 from the .75-percent tax on meals at restaurants (on top of the 6.25-percent state tax). The $3.3-million total surpassed the nearly $3 million collected in fiscal year 2019 before COVID-19. At the depth of the shutdowns during the pandemic in 2020-21, the collections had plummeted to less than $1.2 million, according to official data.
Collections have climbed steadily since then.
Andover Meals and Hotel Tax Collections By Year
| Meals | Hotel/Motel | Total | |
| 2023 | 664,000 | 1,235,000 | 1,899,000 |
| 2022 | 575,000 | 900,000 | 1,475,000 |
| 2021 | 470,499 | 699,991 | 1,170,490 |
| 2020 | 601,416 | 1,807,513 | 2,408,929 |
| 2019 | 622,132 | 236,307 | 2,982,439 |
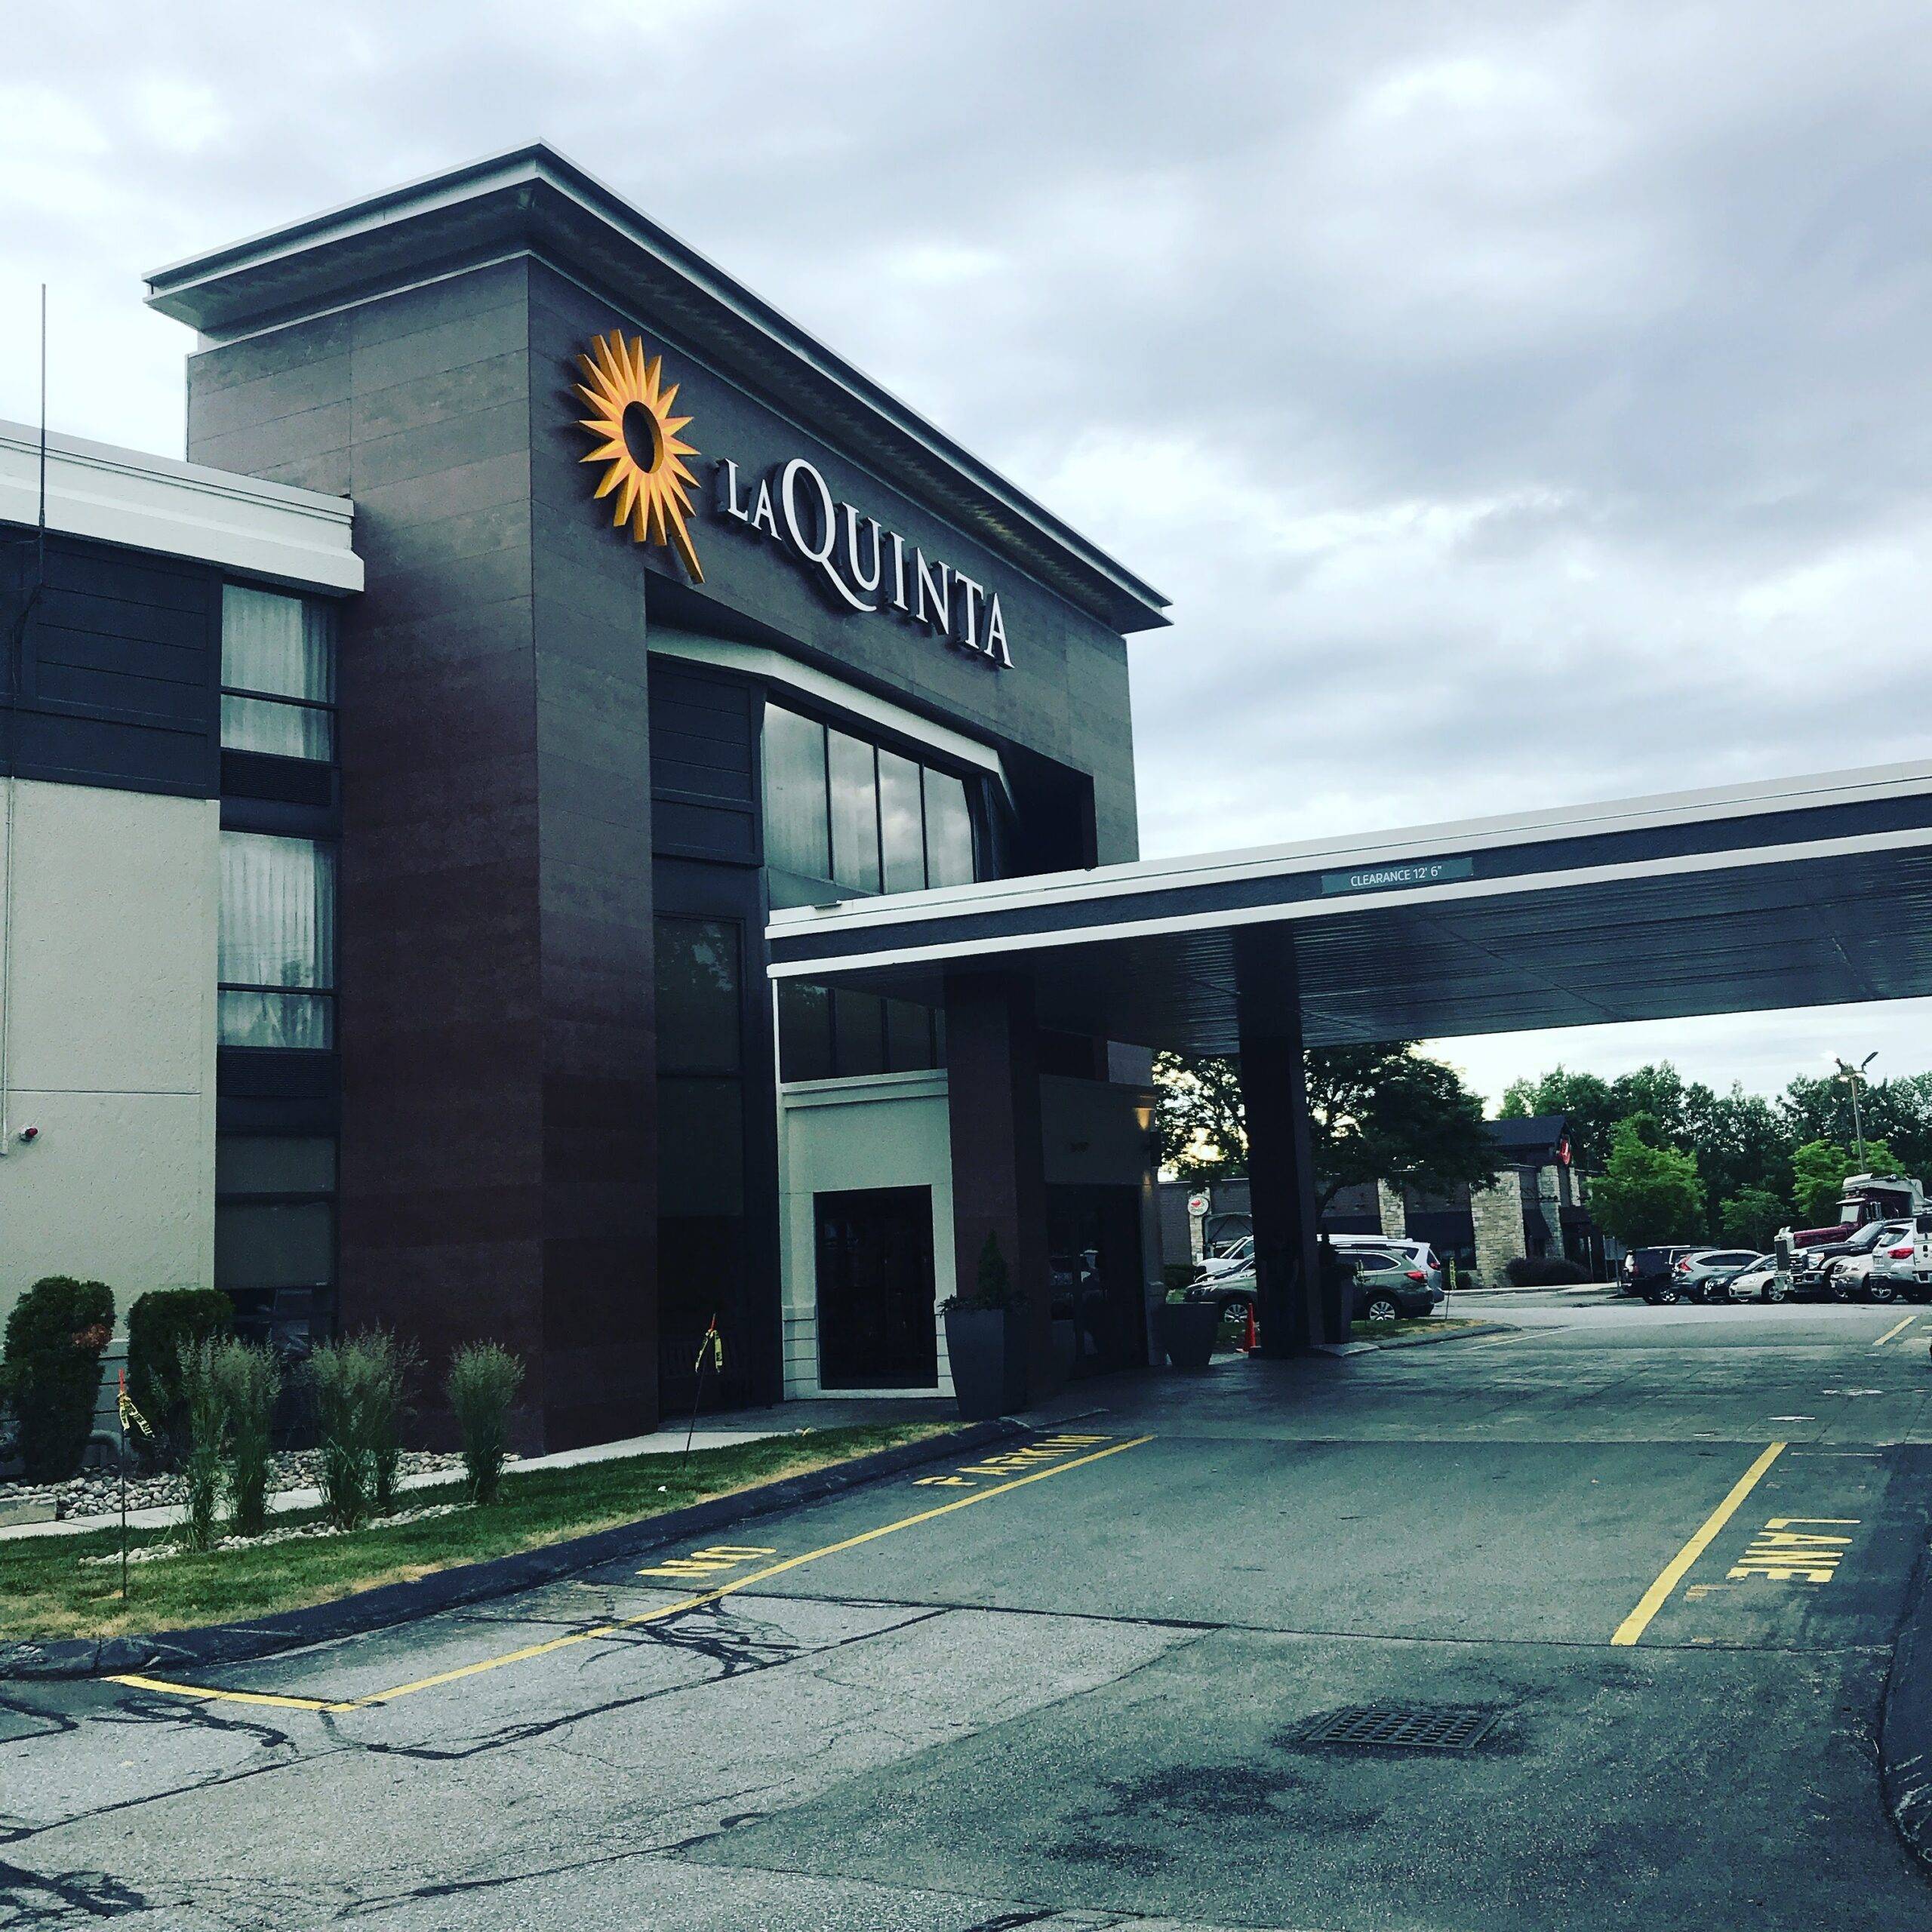
Andover currently has “nine hotel addresses … and two bed-and-breakfast addresses … registered” with the state, according to Nathalie Dailida, legislative and external affairs director of the state’s Department of Revenue. In response to a request by Andover News for specific proceeds generated by the town’s hotels clustered along and near River Road, Dailida said: “Due to confidentiality laws, the Department of Revenue is unable to provide taxpayer specific information.”
Among 16 towns Andover considers peers for comparing various municipal performance metrics, in the category of local-option tax receipts, Andover ranked number one for the last fiscal year. Rounding out the top five were Natick, Needham, Newburyport, and Lexington.
FY 24 Local Option Taxes for comparable towns
| Meals | Hotel/Motel | Total | Rank | |
| Acton | 444,139 | 36,418 | 480,557 | 13 |
| Andover | 873,080 | 2,430,773 | 3,303,853 | 1 |
| Arlington | 691,902 | 616,944 | 1,308,846 | 6 |
| Bedford | 410,390 | 266,742 | 677,132 | 11 |
| Concord | 460,363 | 524,710 | 985,073 | 8 |
| Hingham | 1,092,630 | 0 | 1,092,630 | 7 |
| Lexington | 509,726 | 841,526 | 1,351,252 | 5 |
| Marblehead * | 0 | 0 | 0 | 16 |
| Natick | 1,122,981 | 1,565,628 | 2,688,609 | 2 |
| Needham | 638,248 | 1,580,395 | 2,218,643 | 3 |
| Newburyport | 916,632 | 527,170 | 1,443,802 | 4 |
| North Andover | 785,535 | 27,753 | 813,288 | 10 |
| Norwell | 343,545 | 0 | 343,545 | 14 |
| Sudbury | 356,751 | 150,556 | 484,638 | 12 |
| Wellesley | 914,342 | 59,118 | 973,460 | 9 |
| Winchester | 247,141 | 0 | 247,141 | 15 |
| STATEWIDE TOTALS | 186,410,399 | 358,837,693 |
Source: Massachusetts Department of Revenue
* Marblehead adopted local meals and hotel taxes on 7-1-24

